Active:
49 articles in Product Analytics

Full ArticleProduct Analytics
🔵 Google Transforms the Design Process with "Vibe Design" Agents
And: OpenAI's secret "super app", Claude Dispatch, why Vercel's CEO is happy an engineer spent $10,000 in one day
Department of Product·11 min read·Mar 20, 2026
Full ArticleProduct Analytics
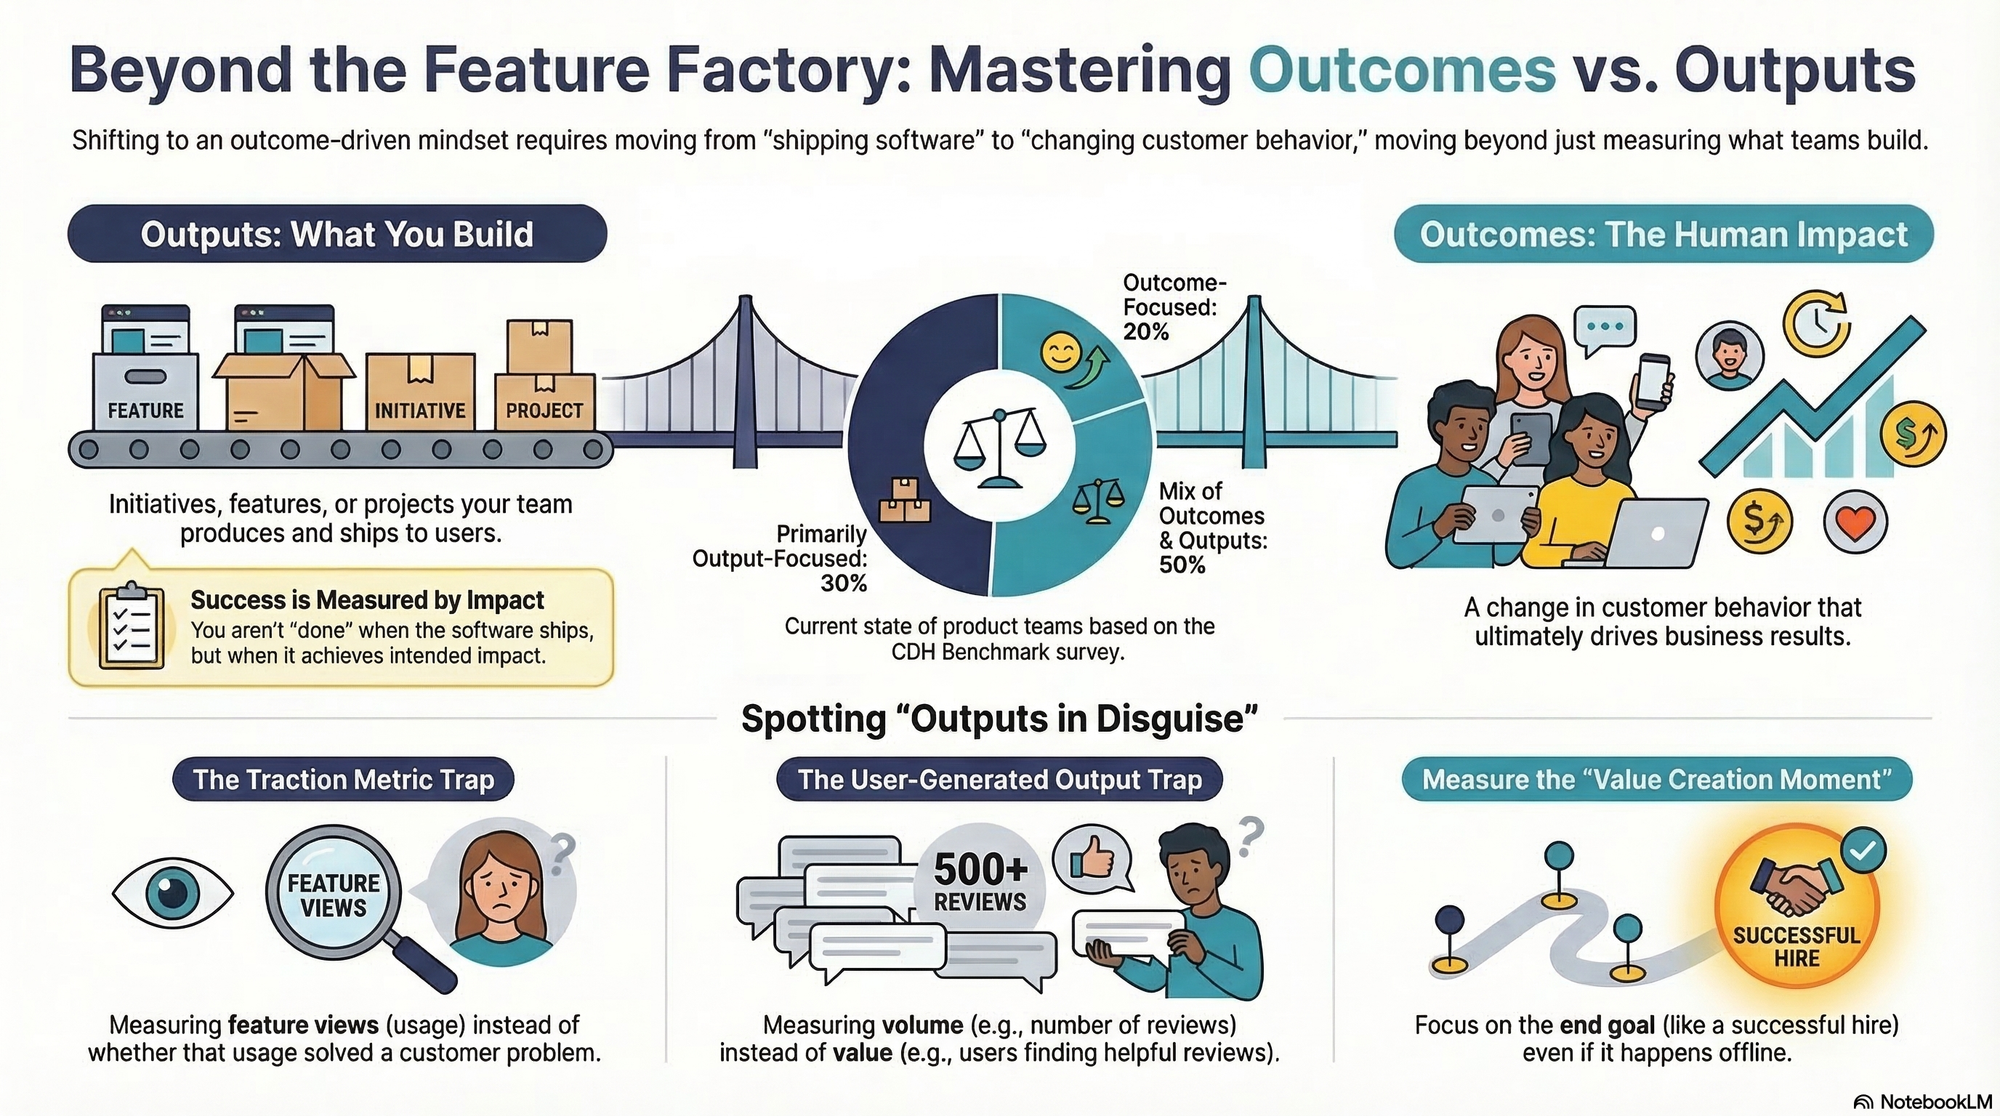
Outcomes vs. Outputs: What's the Difference and Why Does It Matter?
What's the difference between outcomes vs. outputs? Walk through clear-cut and tricky examples, common mistakes, and practical steps.
Product Talk (Teresa Torres)·11 min read·Mar 18, 2026
Full ArticleProduct Analytics
When Good Teams Get Forced Into Bad Narratives
I run dozens of roadmap clinics every year, and theres a version of the same conversation that keeps repeating. A platform lead, an infrastructure team, a design systems group, someone The post When Good Teams Get Forced Into Bad Narratives appeared first on ProdPad.
ProdPad·11 min read·Mar 12, 2026

Full ArticleProduct Analytics
Get the Outcomes on Your Product Roadmap Right
Product outcomes define the specific value a product creates—for users, customers, and the business. When applied correctly, they align stakeholders, create focus, and give development teams clear direction. But getting them right isn’t easy. Too often, product teams choose outcomes that are vague, oversized, or worse, features dressed up as goals. The result? Confusion, misalignment, and roadmaps that look strategic but fail to drive meaningful impact. In this article, I’ll address these issues
Roman Pichler·16 min read·Mar 9, 2026
Full ArticleProduct Analytics
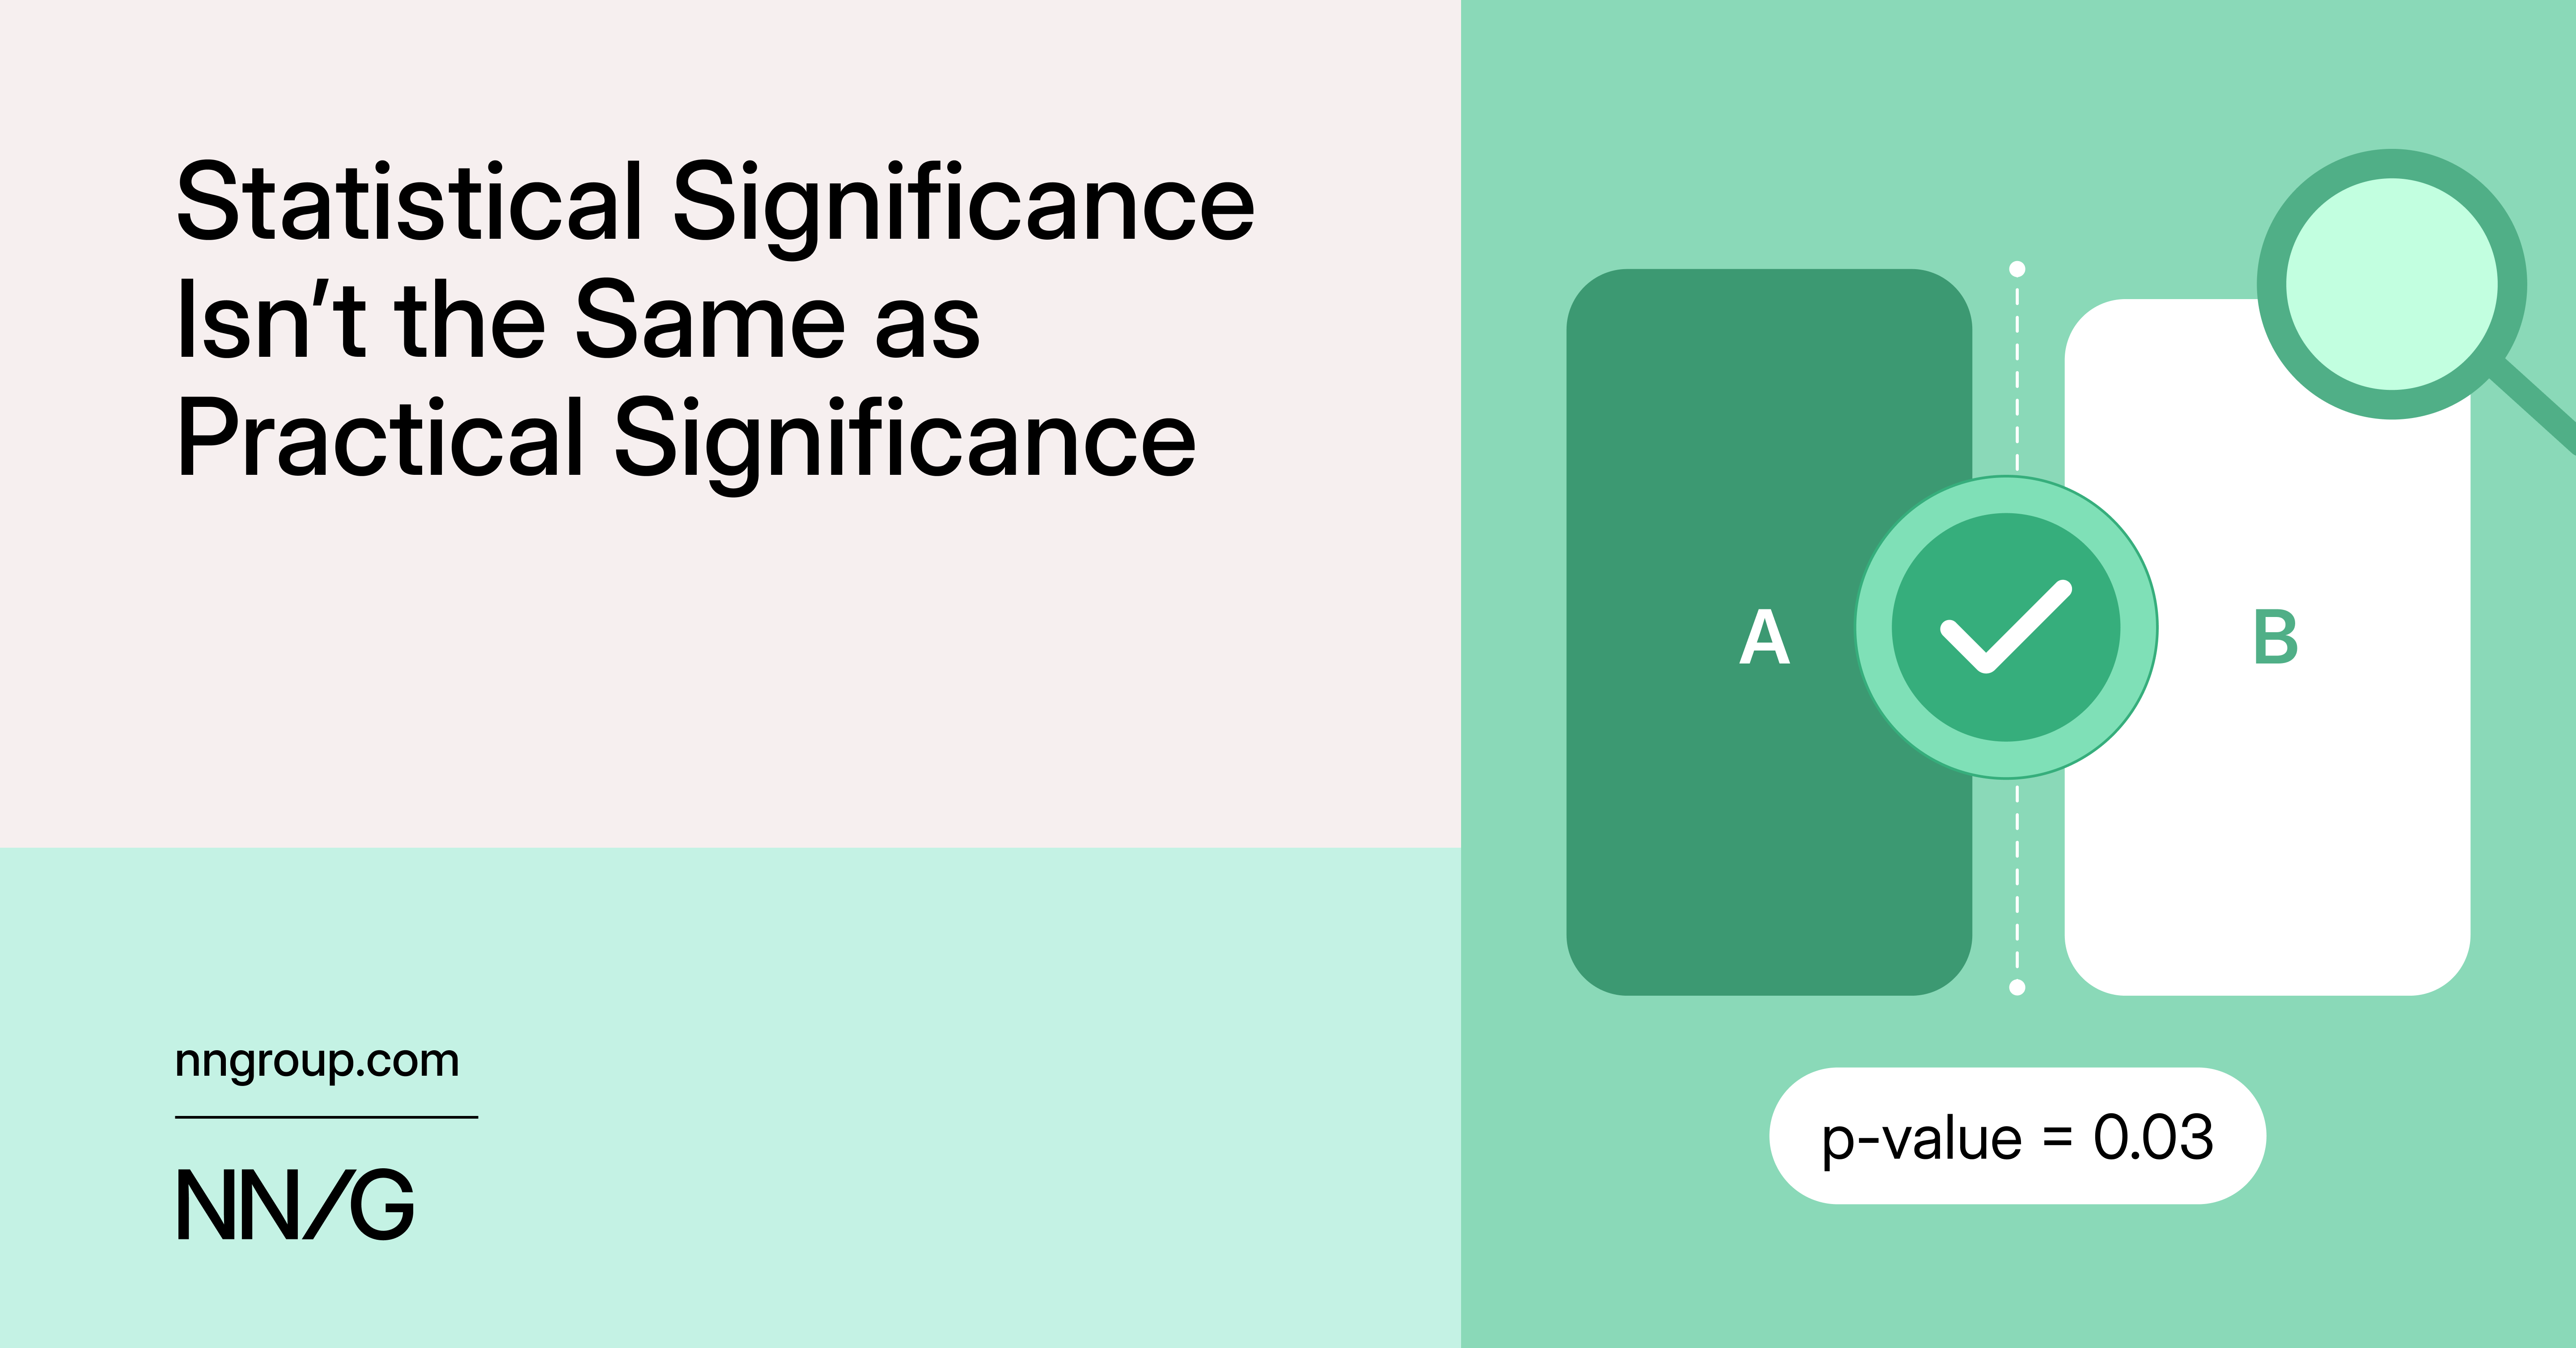
Statistical Significance Isn’t the Same as Practical Significance
Statistical significance helps establish whether a result is reliable, while practical significance helps determine whether it is worth acting on.
Nielsen Norman Group·9 min read·Mar 6, 2026
Full ArticleProduct Analytics
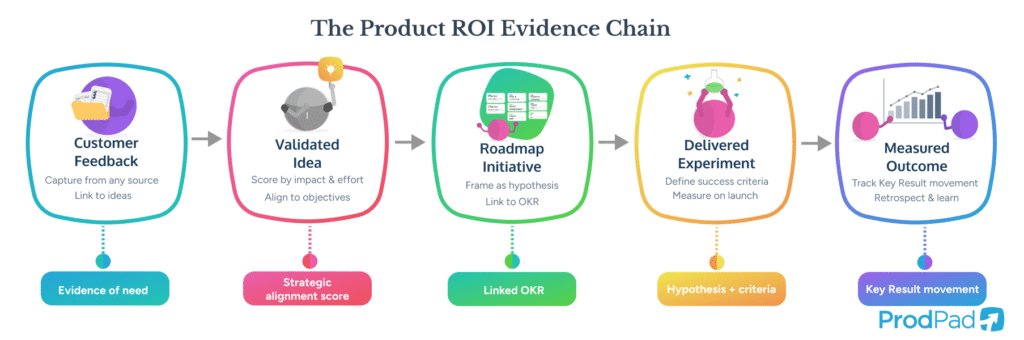
Proving Product ROI: How to Demonstrate the Value of Product Work
A Head of Product I was talking to last month summed up her situation in one sentence: My team shipped 47 features last year, and the CFO still asks me The post Proving Product ROI: How to Demonstrate the Value of Product Work appeared first on ProdPad.
ProdPad·19 min read·Mar 5, 2026
Full ArticleProduct Analytics
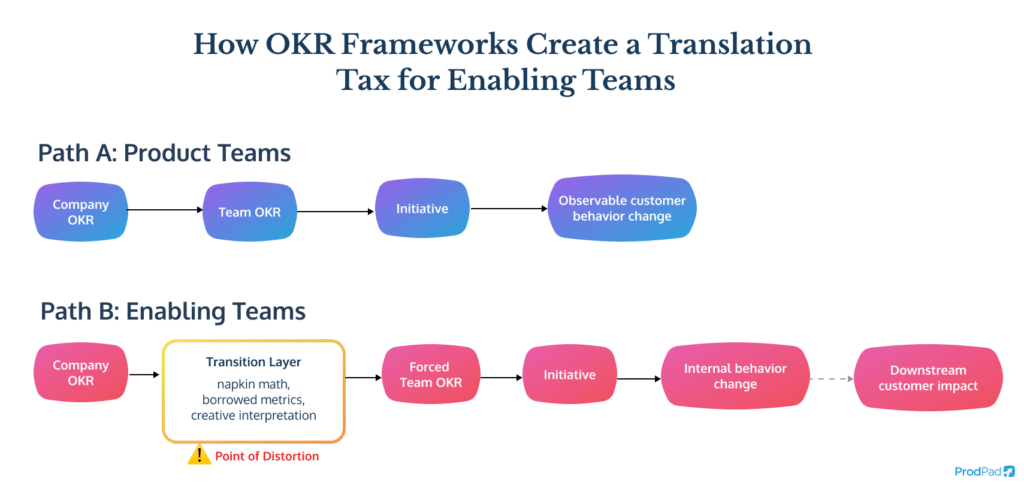
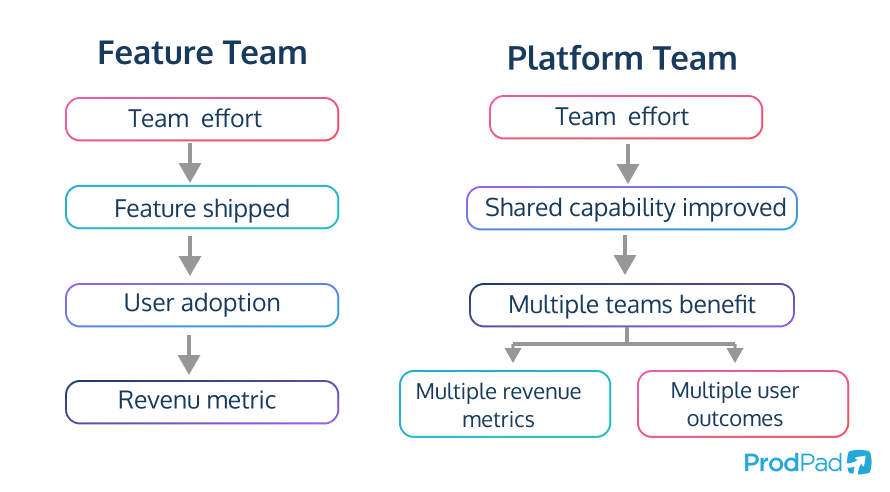
Stop Making Platform Teams Pretend to Be Revenue Teams
Every quarter, a ritual plays out across Product and Engineering organizations: platform teams sit down to write their OKRs, and the discomfort starts immediately. The objectives that honestly describe their The post Stop Making Platform Teams Pretend to Be Revenue Teams appeared first on ProdPad.
ProdPad·14 min read·Feb 26, 2026
Full ArticleProduct Analytics
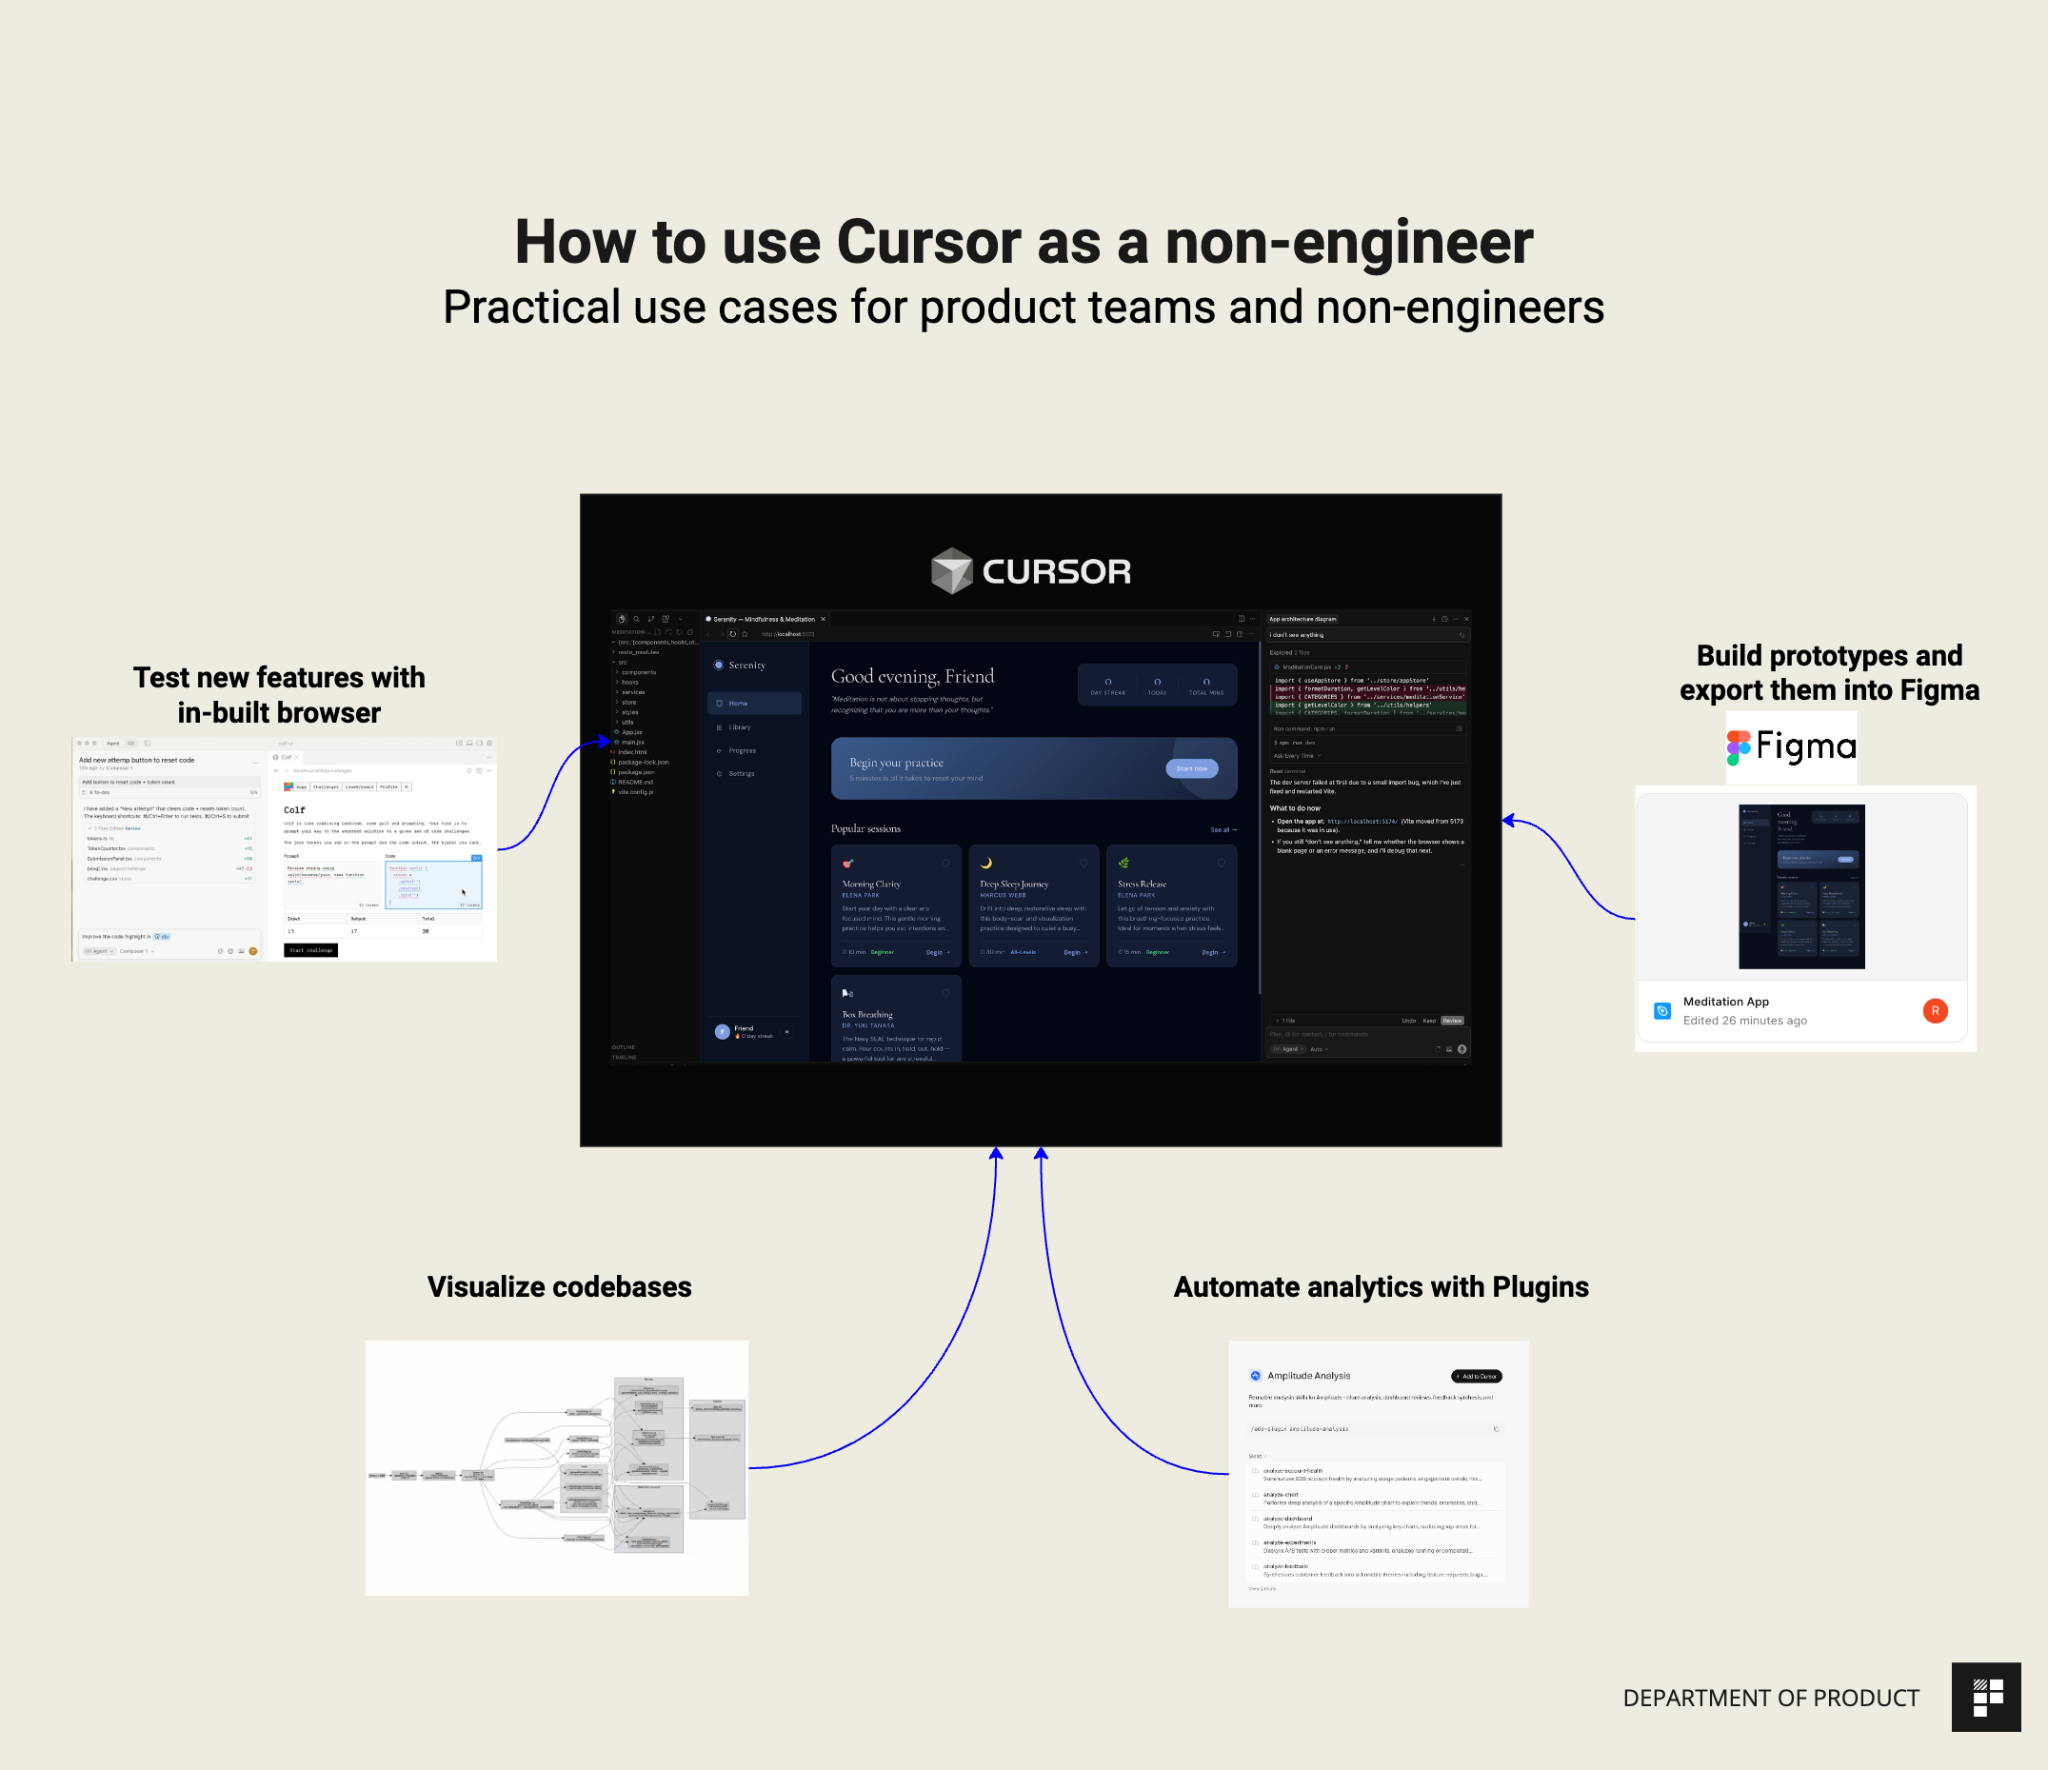
How to use Cursor for Non-Engineering use cases
Test new features, Visualize codebases, Send prototypes to Figma using the new Claude Code integration. Get to grips with the essential Cursor use cases in under an hour. Knowledge Series #101
Department of Product·3 min read·Feb 23, 2026
Full ArticleProduct Analytics
Building AI Sales Reps: How ShowMe Orchestrates Voice, Video, and Multi-Agent Workflows to Close Deals
Listen to this episode on: Spotify | Apple PodcastsWhat happens when you treat an AI agent not as a chatbot, but as a full teammate on your sales team – one that can jump on video calls, demo your product, make phone calls, and follow up over days?In this
Product Talk (Teresa Torres)·3 min read·Feb 19, 2026
Full ArticleProduct Analytics
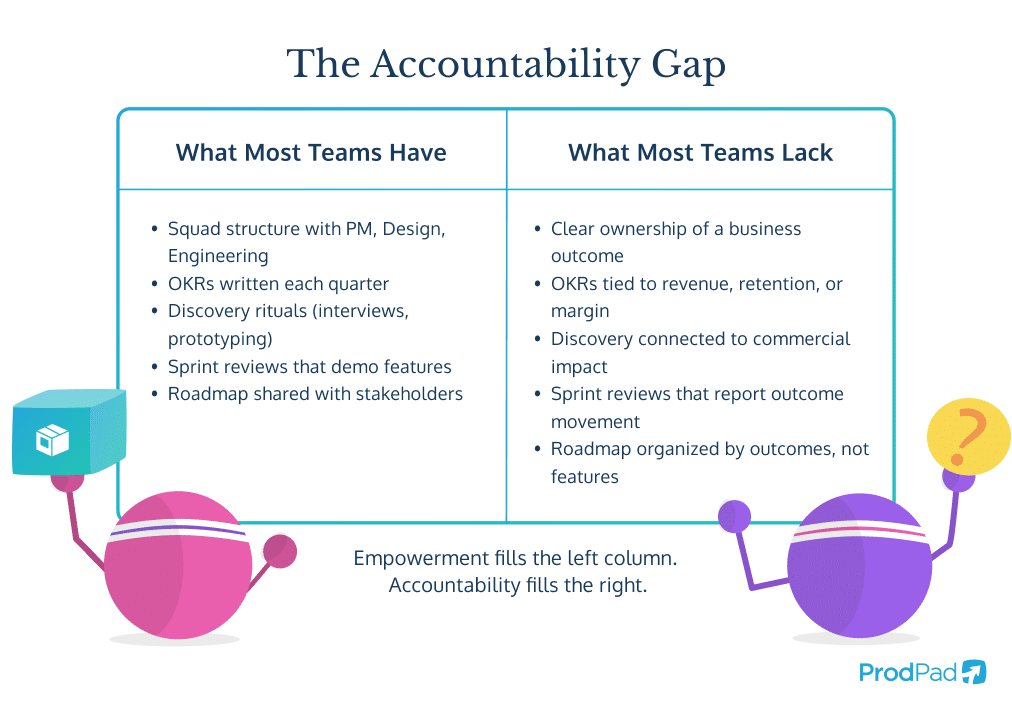
Product Teams Dont Need More Autonomy. They Need Clearer Accountability
Empowerment has become one of those words the Product Management industry uses so often it has stopped meaning anything. Every second job ad, conference talk, and leadership manifesto promises empowered The post Product Teams Dont Need More Autonomy. They Need Clearer Accountability appeared first on ProdPad.
ProdPad·14 min read·Feb 18, 2026
Full ArticleProduct Analytics
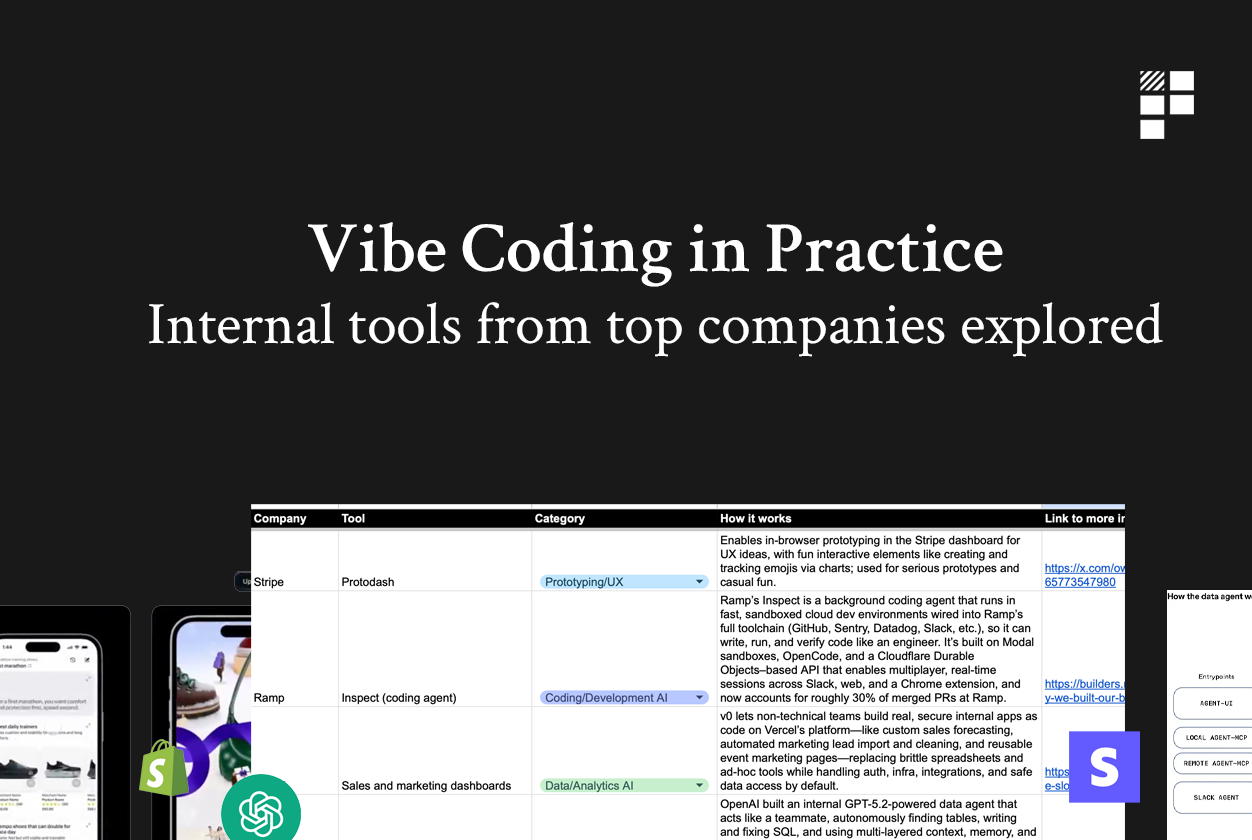
Deep: How Stripe builds prototypes in the browser
Vibe coding in practice: What the worlds top companies are actually building internally. Examples from Stripe, Shopify, Cursor, Figma and more.
Department of Product·6 min read·Feb 9, 2026

Full ArticleProduct Analytics
How to Combine Product Strategy, OKRs, and KPIs
Product strategy, OKRs, and KPIs are popular product management frameworks. But how can they be applied successfully together? What comes first, strategy, OKRs, or KPIs? Can OKRs describe or replace strategy? And what should you do when a senior stakeholder tells you what OKRs and KPIs to use? Read on to find out my answers.
Roman Pichler·5 min read·Sep 8, 2025
Full ArticleProduct Analytics
Performance Optimization: A Systematic Approach
How to approach performance optimization methodically — measuring before optimizing, identifying bottlenecks, and applying the right techniques without premature optimization.
Classic Articles·8 min read·Jan 1, 2023
Full ArticleProduct Analytics
Data Analysis Fundamentals: From Raw Numbers to Actionable Insights
Data without analysis is noise; analysis without context is dangerous. This article provides a foundational toolkit for product professionals who need to work with data but are not statisticians. It covers descriptive statistics (mean, median, distribution), basic inferential statistics (significance testing, confidence intervals), common pitfalls (Simpson's paradox, survivorship bias, correlation vs causation), and data visualization principles. The emphasis is on developing statistical intuition rather than mathematical rigor, with real product analytics examples throughout.
MIT Sloan Management Review·15 min read·Jan 1, 2023
Full ArticleProduct Analytics
Qualitative vs. Quantitative Research: Choosing the Right Approach
The debate between qualitative and quantitative research is a false dichotomy — the best researchers use both, strategically. This article explains when each approach is most valuable: qualitative research (interviews, observations, diary studies) for exploring 'why' and generating hypotheses; quantitative research (surveys, A/B tests, analytics) for testing hypotheses and measuring 'how much.' It provides a decision framework for choosing methods based on research questions, maturity of understanding, and available resources, with practical examples from product development and UX research.
Nielsen Norman Group·10 min read·Jan 1, 2023
Full ArticleProduct Analytics
How Netflix Built the World's Most Sophisticated Recommendation Engine
Netflix attributes over 80% of content watched to its recommendation system. This case study traces the evolution from the Netflix Prize competition to modern deep learning approaches, examining how product and engineering teams collaborate to personalize content for 230 million subscribers across diverse global markets.
MIT Sloan Management Review·18 min read·Jan 1, 2023
Full ArticleProduct Analytics
Google's HEART Framework: How to Conduct User Research at Scale
Google's HEART framework (Happiness, Engagement, Adoption, Retention, Task success) provides a systematic approach to measuring user experience at scale. This case study explains how Google Research developed the framework, how teams across the company apply it, and how it bridges the gap between qualitative insights and quantitative metrics.
Nielsen Norman Group·13 min read·Jan 1, 2023
Full ArticleProduct Analytics
How TikTok's Algorithm Drives Engagement: The Product Behind the Addiction
TikTok's recommendation algorithm is widely considered the most sophisticated content discovery system ever built for consumer social media. This case study examines how the For You Page works, how the product team balances engagement metrics with user wellbeing, and what the algorithmic feed model means for the future of content platforms.
MIT Sloan Management Review·18 min read·Jan 1, 2023
Full ArticleProduct Analytics
How Instagram's Feed Algorithm Redesign Changed Social Media Product Design
Instagram's 2016 shift from chronological to algorithmic feed was one of the most controversial product decisions in social media history. This case study examines the data behind the decision, how the team iterated on ranking signals, managed user backlash, and ultimately increased engagement while setting a template that every social platform would follow.
MIT Sloan Management Review·14 min read·Jan 1, 2023
Full ArticleProduct Analytics
Startup Metrics That Actually Matter
A guide to the key metrics every startup should track, organized by stage, with explanations of why vanity metrics are dangerous and how to focus on what drives the business.
Classic Articles·8 min read·Jan 1, 2023